Austrian University tested influence of Traction Control
Higher productivity with the SERVO 45 plough
- 28.02.2010
-
 Arados
Assessment of the influence of Traction Control on tractor fuel consumption and wheel slip
Markus Schüller*. Gerhard Moitzi*. Helmut Wagentristl**;
* Institute for Agriculture, University for Soil Sciences, Vienna
** Test farming project at Groß Enzersdorf, University for Soil Sciences, Vienna
Introduction:
Energy-efficient tillage is an important requirement for reducing costs at a time when high diesel prices and low profit margins threaten the liquidity of our farming businesses. Pöttinger has developed the "Traction Control" system to reduce diesel consumption. This system minimises wheel slip to improve the productivity of machinery while reducing diesel consumption per area covered.1. Test method:
a. Location and soil:
Test location: Raasdorf (Lower Austria)Raasdorf was selected as the test location, approx. 8 km east of Vienna. This area is in the pannonian climate zone. The soil is made up of deep-lying chernozem black soil rich in deposits from chalk through to fine gravel. This type of soil produces very good tillage results.
Test location: Sigleß (Burgenland)
Sigleß is located approx. 4 km north of Mattersburg. This area is on the edge of the pannonian climate zone. The soil is made up of tea-green marl, with some chalk in places. Water table influences are favourable with high water retention capacity and low porosity characteristics. The heavy tillage required produces larger sized clumps and has all the disadvantages of classic clay soil.
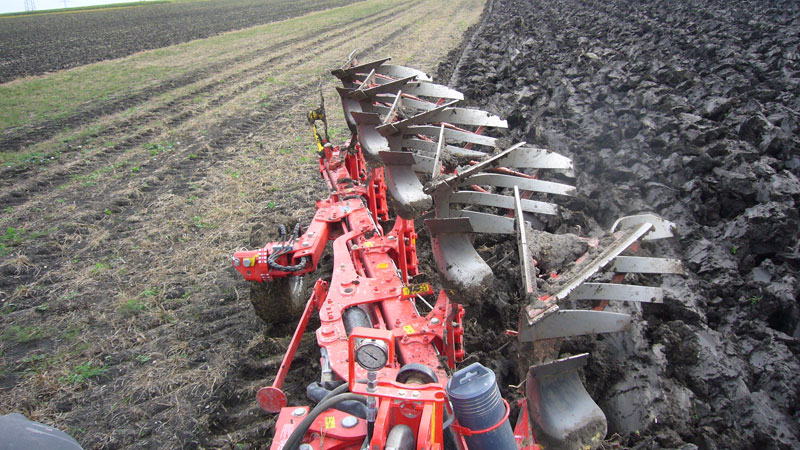
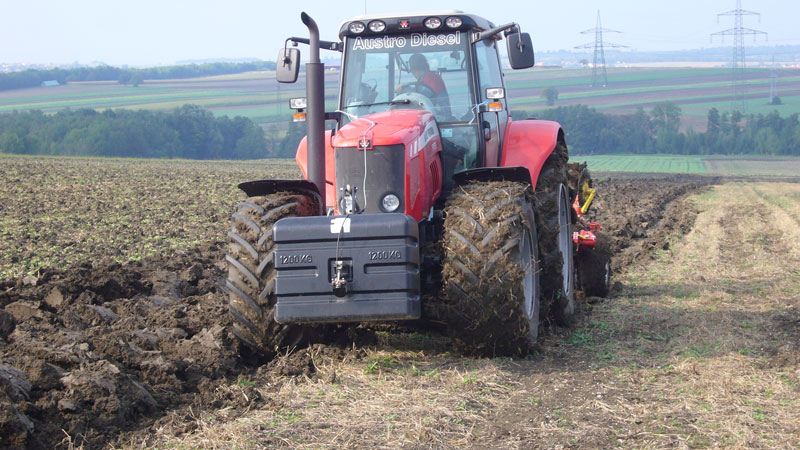 Operating in difficult conditions |
 Full power ahead |
 Traction Control |
b. Data acquisition:
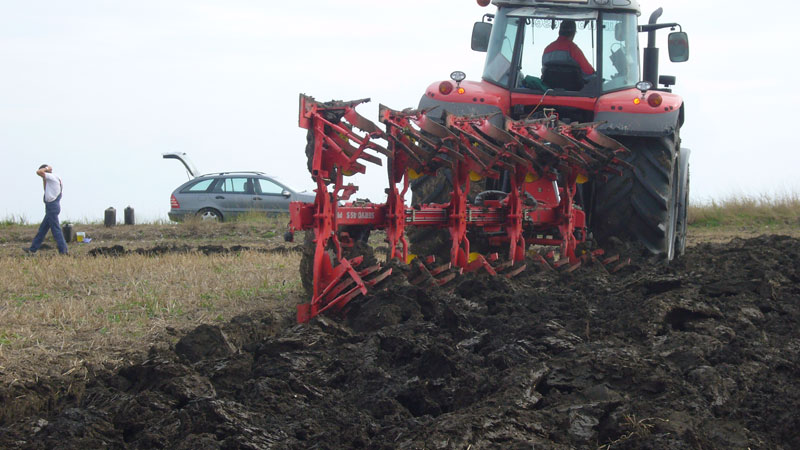
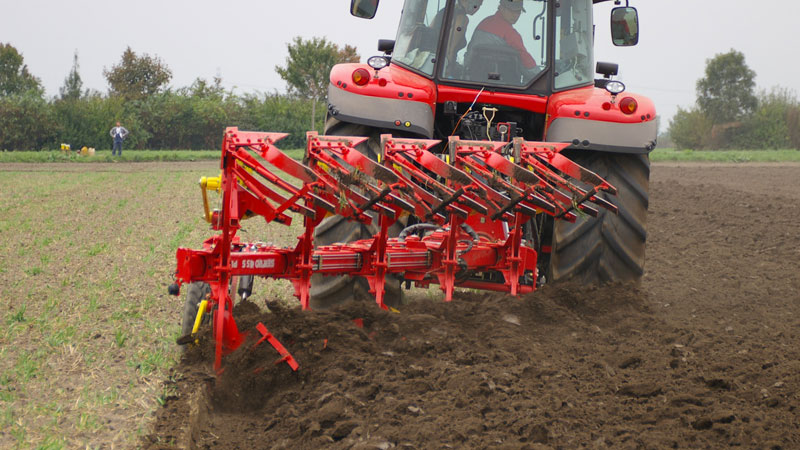
Several methods are available for measuring fuel consumption. Based on previous experience, the most straightforward and reliable method was selected. A volumetric fuel measurement was made while "topping up" in the field. A test run consisted of driving 2 field lengths and a headland turn. Three test runs were made for each type of tillage pass. Before starting each test run, the place at which the fuel should be topped up was marked precisely. This was to ensure that the tractor was always at exactly the same location while it was being filled up to ensure there were no fluctuations in the diesel tank. The metal ring below the thread on the tank was used as the reference mark. This ensured a constant filling level. Using precision timing the headland turn was subtracted from each test run and the remaining figures converted into net fuel consumption for one hectare. The headland turn was performed using speed management and a standardised sequence at constant engine speed, so the turning time was virtually always the same. During tillage passes the travelling speed and engine speed were specified in order to keep the main working time as constant as possible as well – i.e. to cut out the tractor driver's influence. A tractor drove along the headland at each end of the field to mark out the precise field length before each measurement. This defined the start and finish of each tillage pass. The lifting and lowering of the tillage implement was also specified.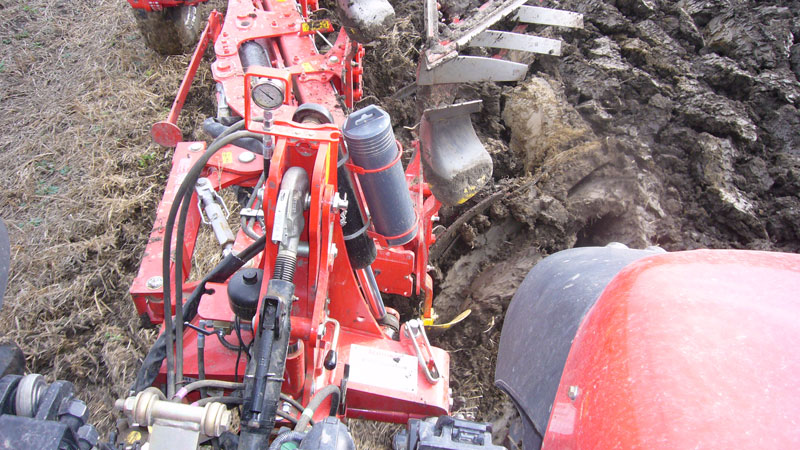 SERVO in action in Sigleß |
 SERVO in action in Sigleß |
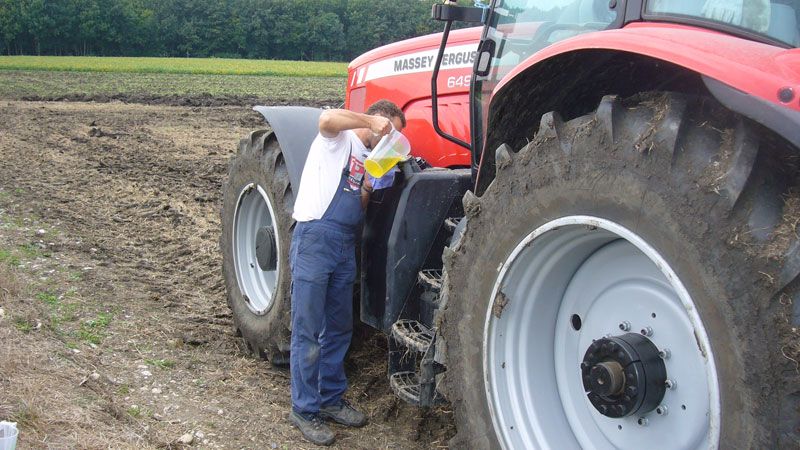 Topping up the tractor |
c. Tillage settings:
| Test location: Raasdorf | |||
| Engine speed | Driving speed | Gears | |
| Main time (working pass) | 1850 rpm | ca. 8 kph | 2 F |
| Turning time (headland) | 1250 rpm | ca. 4 kph | 2 D |
working width: ea. 52 cm = 2.6 metres
working depth: 25 cm
| Test location: Sigleß | |||
| Engine speed | Driving speed | Gears | |
| Main time (working pass) | 1830 rpm | ca. 6 kph | 2 D |
| Turning time (headland) | 1250 rpm | ca. 4 kph | 2 D |
working width: ea. 32 cm = 1,6 m
working depth: 18 cm
d. Weights
| Tractor + Plough | 12.440 kg |
| Tractor empty | 8.300 kg |
| Front ballast | 1.200 kg |
| Front axle + Plough | 3.090 kg |
| Rear axle + Plough | 9.340 kg |
2. Evaluation and results:
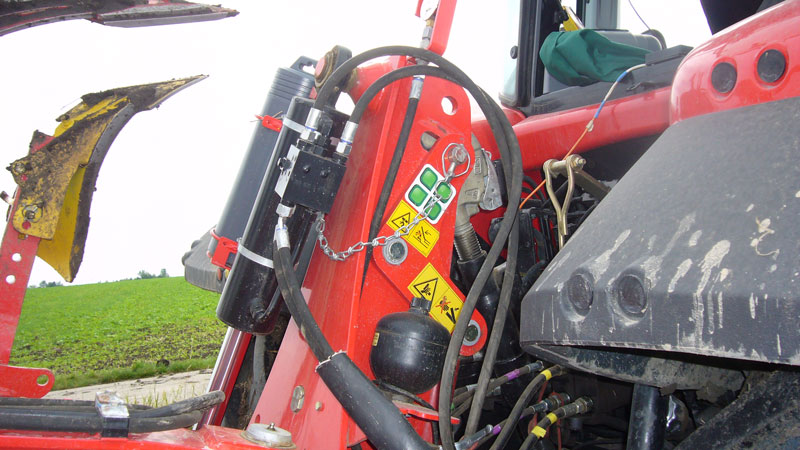
The results are mean values from 3 repetitions. The wheel slip of the tractor was also determined. The wheel slip was measured using two sensors. A wheel sensor was fitted to measure the theoretical speed of the tractor. The actual speed of the tractor was measured using a radar sensor mounted on the front ballast weights. The ground clearance is constant at this point. The table below shows the results and driving strategy obtained during the trials at Raasdorf.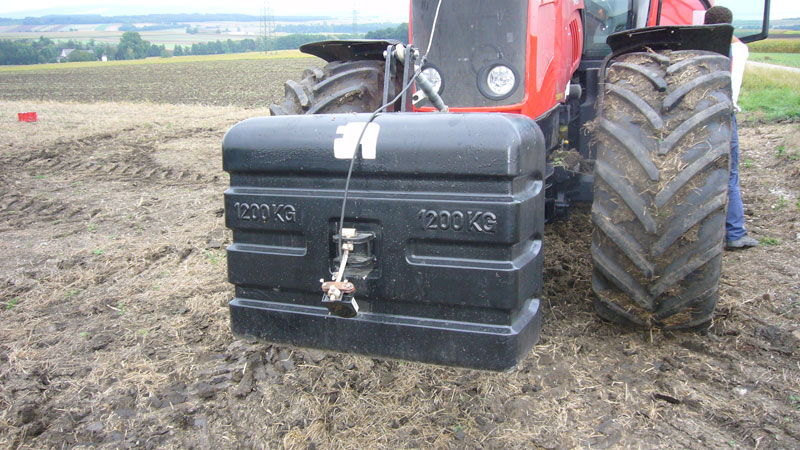 The radar sensor |
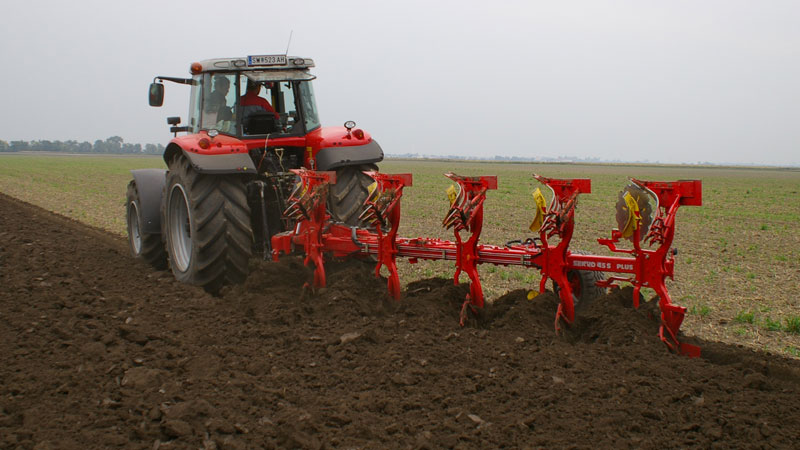 In action in Raasdorf |
 In action in Raasdorf |
Sigleß (B)
Table 1: Performance and consumption data for different driving strategies in Sigleß (Burgenland), heavy soil.| Driving strategy | without Traction Control, with Electronic Hitch Control | Traction Control without Electronic Hitch Control |
| Performance (ha/h) | 0,84 | 0,86 |
| Diesel consumption (l/ha) | 40,6 | 39,2 |
| Diesel consumption (l/h) | 33,9 | 33,7 |
| Slip (%) | 15,37 | 14,04 |
The results relate to pure ploughing time, i.e. the headland turn has been subtracted.
Tabelle 2: Layer compaction and soil moisture measured gravimetrically at the time of the trial for soil depths between 0 and 30 cm at intervals of 5 cm in Sigleß (Burgenland).
| Soil depth cm | Layer compaction φ | Soil moisture % F |
| 0 - 5 | 1,01 | 29,4 |
| 5 - 10 | 1,25 | 30,6 |
| 10 - 15 | 1,37 | 28,0 |
| 15 - 20 | 1,33 | 29,4 |
| 20 - 25 | 1,30 | 30,0 |
| 25 - 30 | 1,25 | 29,2 |
Raasdorf (NÖ)
Table 1: Performance and consumption data for different driving strategies in Raasdorf, medium density soil.| Driving strategy | without Traction Control, with Electronic Hitch Control | Traction Control without Electronic Hitch Control |
| Performance (ha/h) | 1,94 | 2,07 |
| Diesel consumption (l/ha) | 20,5 | 18,4 |
| Diesel consumption (l/h) | 39,7 | 38,0 |
| Slip (%) | 4,8 | 3,3 |
Table 2: Performance and consumption data for different driving strategies in Raasdorf, light soil.
| Driving strategy | without 4WD, without Traction Control, with Electronic Hitch Control | without 4WD, with Traction Control |
| Performance (ha/h) | 1,79 | 1,96 |
| Diesel consumption (l/ha) | 21,4 | 17,5 |
| Diesel consumption (l/h) | 38,3 | 34,4 |
| Slip (%) | 15 | 7,65 |
Table 3: Layer compaction and soil moisture measured gravimetrically at the time of the trial for soil depths between 0 and 30 cm at intervals of 5 cm in Raasdorf (Lower Austria).
| Soil depth cm | Layer compaction φ | Soil moisture % F |
| 0 - 5 | 1,06 | 16,1 |
| 5 - 10 | 1,33 | 20,3 |
| 10 - 15 | 1,49 | 20,6 |
| 15 - 20 | 1,48 | 21,0 |
| 20 - 25 | 1,50 | 21,0 |
| 25 - 30 | 1,36 | 21,3 |